By Jason Rantanen
I’m getting ready to teach my Fall 2023 Patent Law class, and that means updating the granted utility patents graph that I do every few years. This year’s version shows U.S. utility patents granted per year from 1840-2022:
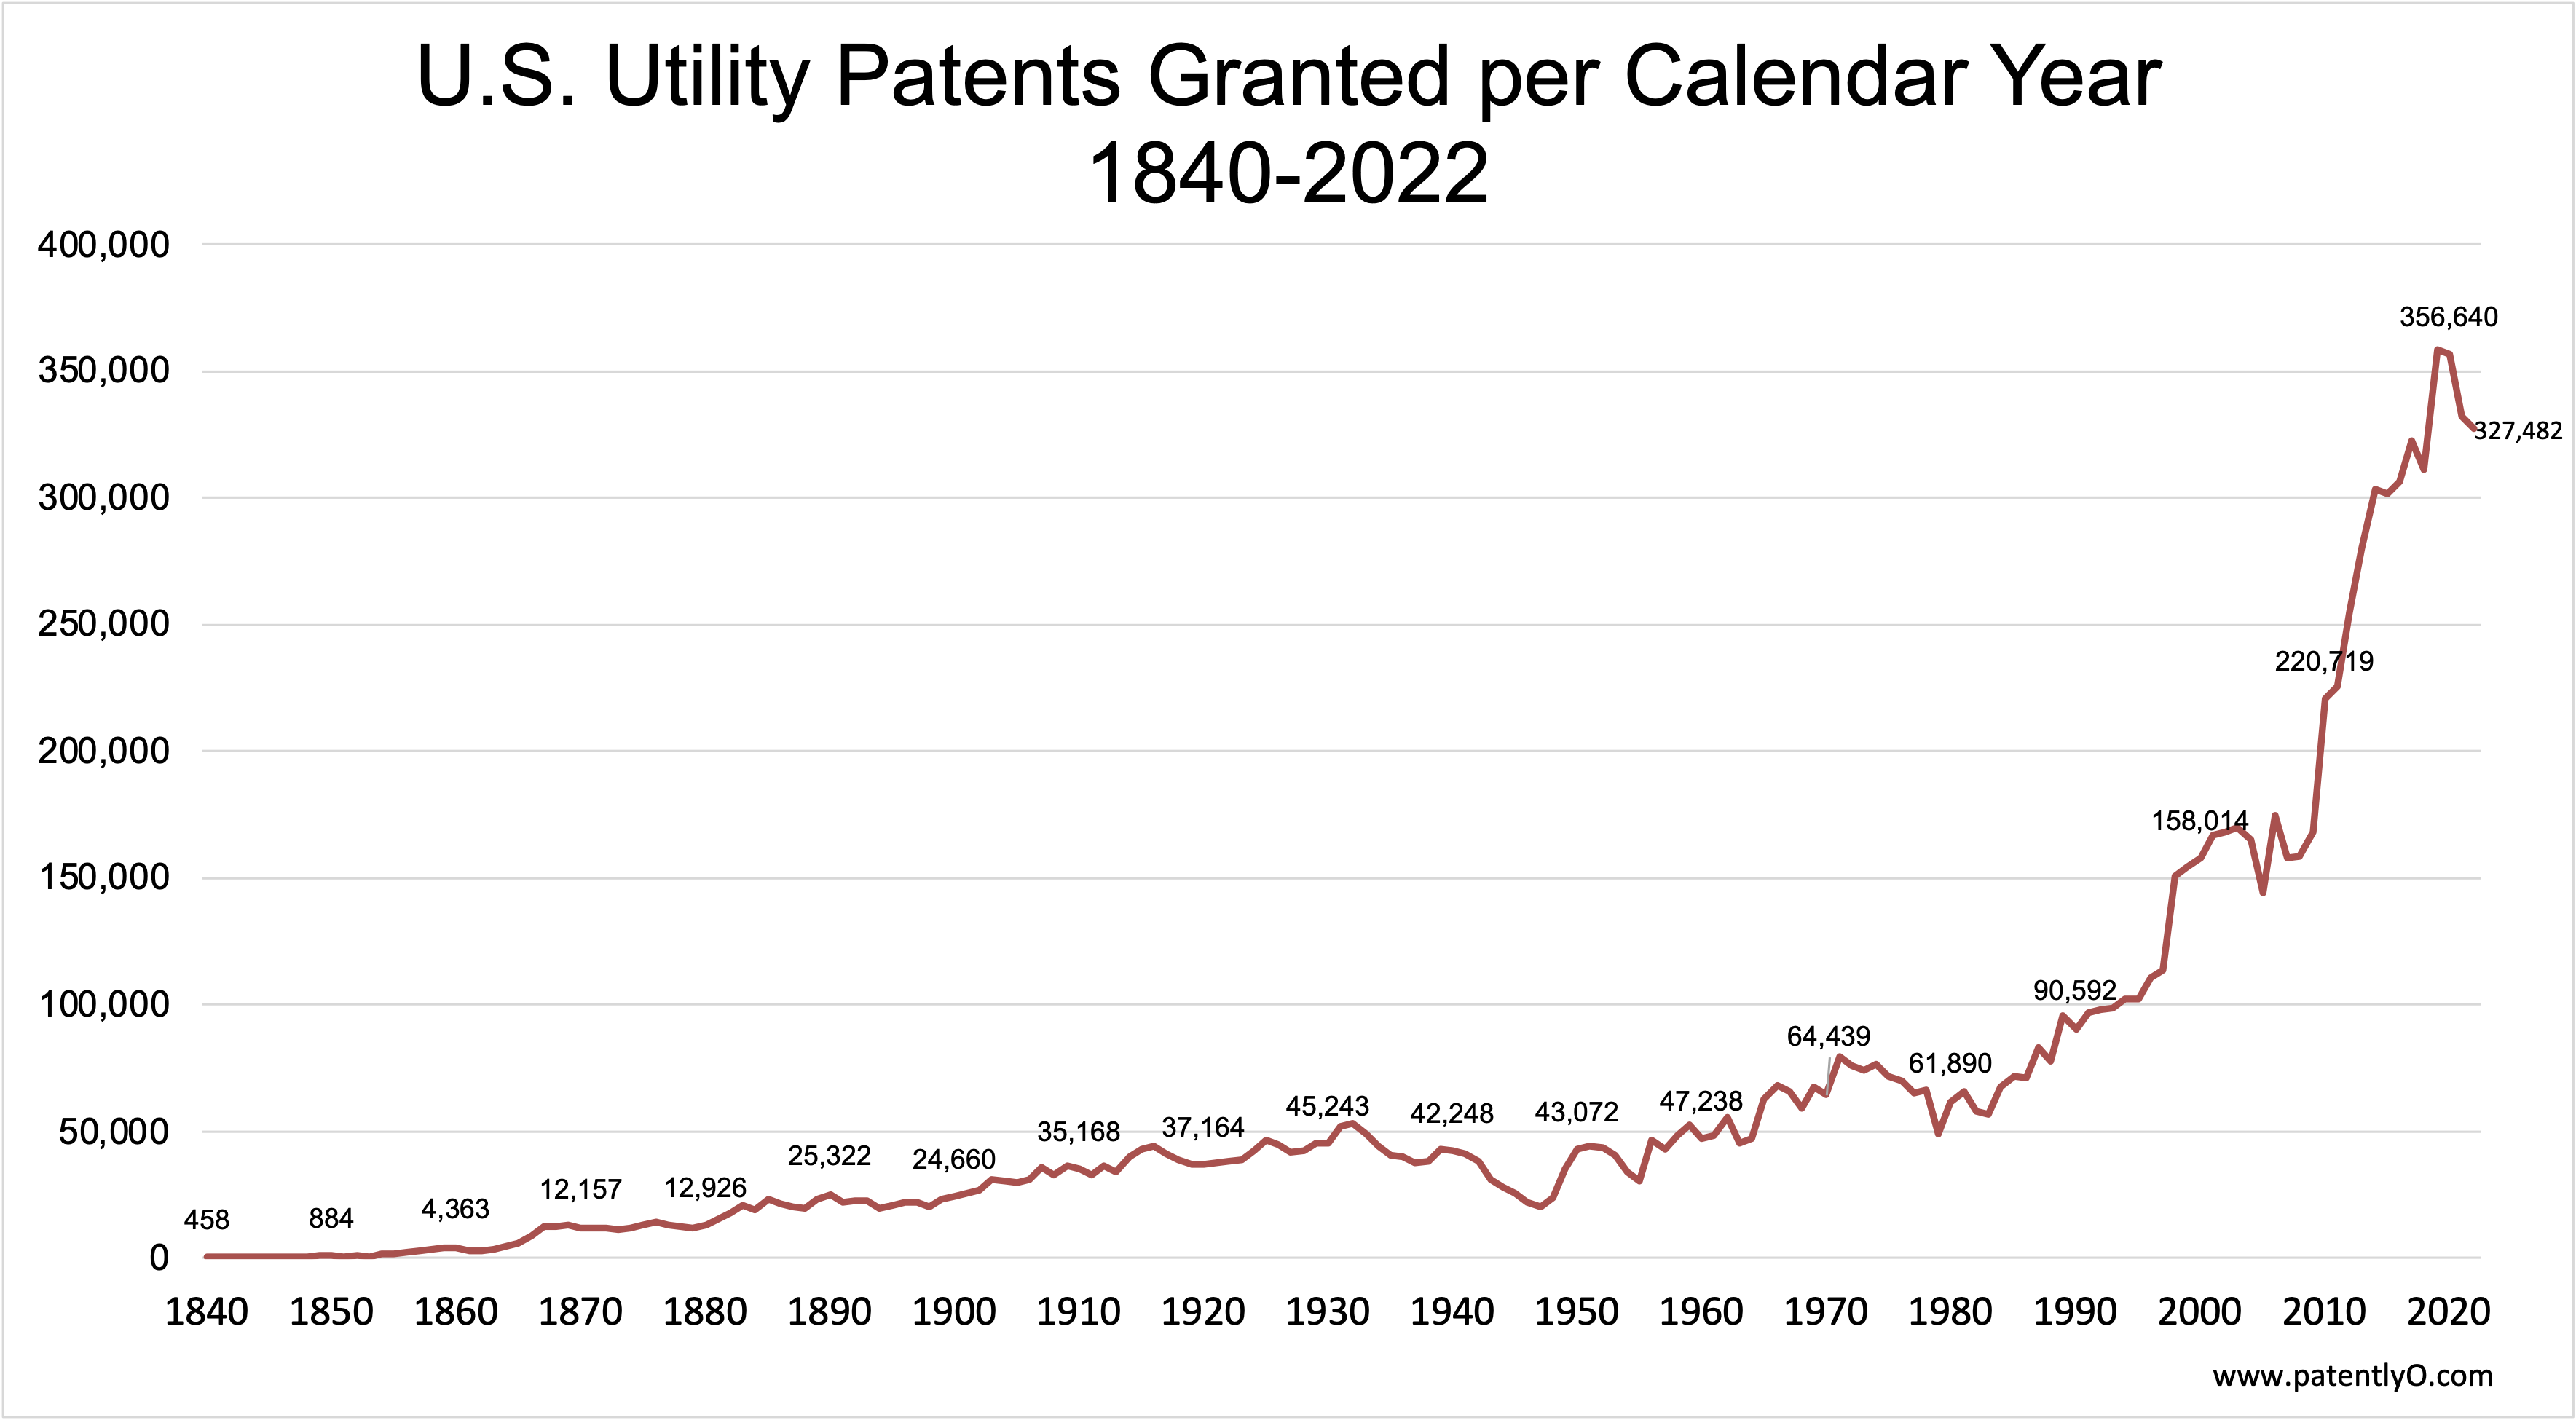
Data for 2023 isn’t included in the table, but as of July 25, 2023, the authority file contains just 171,556 patents. If the pace remains the same, that would work out to about 294,000 patents granted this calendar year–around 10% fewer than 2022 (327,482 granted patents) and around 18% lower than 2020 (356,640 granted patents). (In contrast, at the end of July 2022 there were 186,500 patents listed on the Authority file.) But my sense is that the drop from 2022 may be due to a delay in actually publishing the granted patents rather than reflecting a decline.
In fact, looking at the USPTO’s reported statistics, I’d actually expect more issued patents in 2023 than in 2022. Filings are continuing to trend slightly upwards (there were 457k non-RCE UPR filings in FY 2022, as compared with 450k in FY 2020 and 427k in FY 2018). Allowances are up slightly as well: 253k allowances so far in 2023, as compared with 247k at the same point in 2022. So the decrease in granted patents relative to last year may be the result of a delay between allowance and publication. If you have any insights into this, I’d love to hear them.
One thing that does appear to be real is a drop in allowances relative to 202o, which had 278k allowances by the end of June. This doesn’t appear to be the result of fewer applications or a lower allowance rate–instead, there’s been a large growth in the unexamined application inventory from 570k (June 2020) to 735k (June 2023).
Methodology:
I imported the 2023-07-25 Patent Grant Authority file into STATA and tabulated the number of A1, B1 and B2 kind code records by year. (For those who might be confused by the use of A1, the authority file uses A1 to indicate pre-2001 utility patent grants). I included patents that are marked as Withdrawn. The above graph uses calendar years (Jan. 1 – Dec. 31) instead of FY (fiscal years: Oct 1 to Sept. 30). To predict 2023, I divided the grants as of the 7/25 by 7, then multiplied by 12; the number is similar if weeks are used. Data on filings and allowances comes from the detailed spreadsheet at the bottom of https://www.uspto.gov/dashboard/patents/.